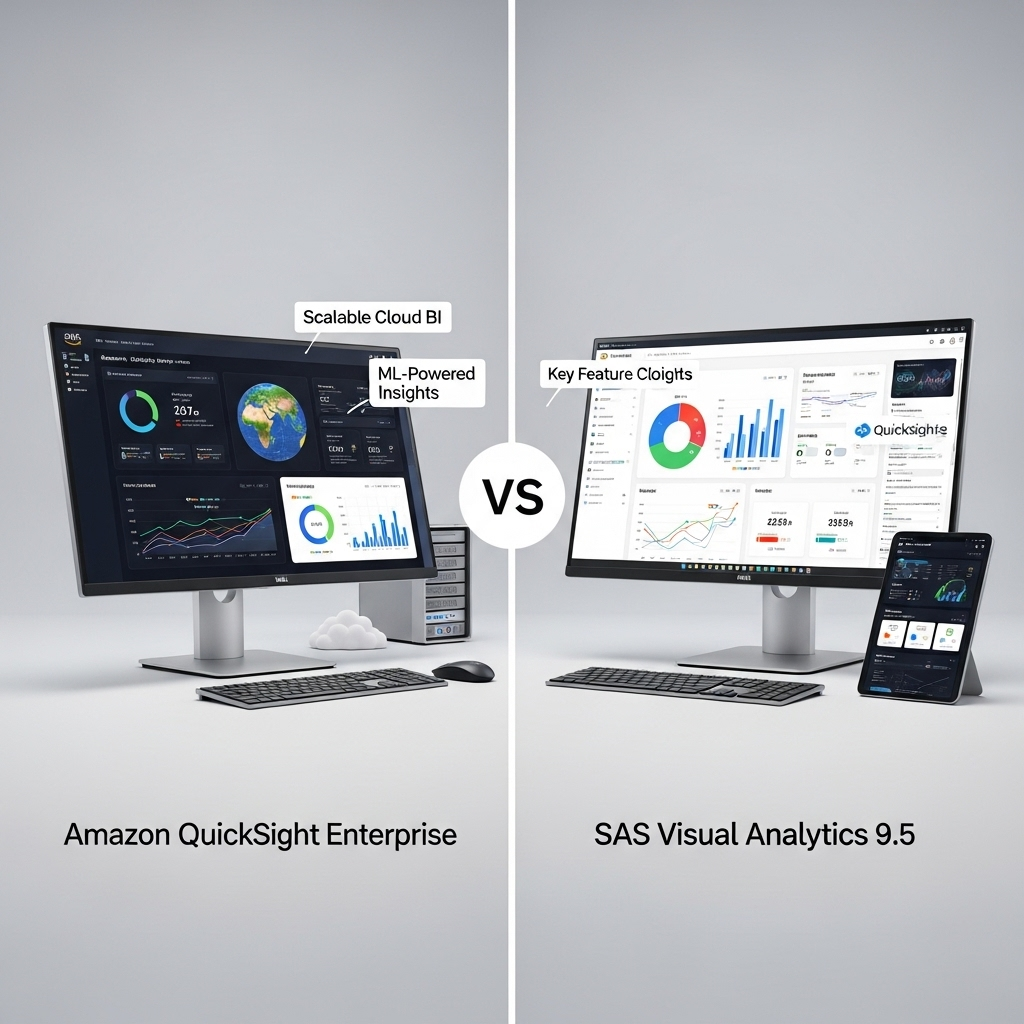
Analytics tools: Amazon QuickSight Enterprise vs. SAS Visual Analytics 9.5
Quick Verdict
Both are powerful analytics tools with strengths in different areas, making the best choice dependent on specific needs and existing infrastructure.
- Both offer a wide range of data visualization capabilities and support for various data sources.
- Amazon QuickSight integrates seamlessly with AWS services, while SAS Visual Analytics integrates with SAS Viya and Microsoft 365.
- SAS Visual Analytics provides native mobile apps, while QuickSight offers mobile app support and browser access.
- Amazon QuickSight offers a pay-as-you-go pricing model, while pricing for SAS Visual Analytics is not available.
Key features – Side-by-Side
| Attribute | Amazon QuickSight Enterprise | SAS Visual Analytics 9.5 |
|---|---|---|
| Data visualization capabilities | Offers interactive data visualization with various charts including bar, line, pie, scatter, heat map, pivot, grouped charts, geospatial charts. AutoGraph suggests appropriate chart types. | Interactive reports and dashboards, visual data exploration, variety of visualizations, third-party JavaScript libraries support. |
| Supported data sources | Connects to AWS services (Amazon RDS, S3, Redshift, Athena), third-party databases (Teradata, MySQL, Postgres, SQL Server), on-premises databases, and SaaS applications (Salesforce, Twitter, GitHub, Jira). Supports file uploads (Excel, CSV, JSON) and connections to data lakes and warehouses like Databricks, Snowflake, and Teradata. | Amazon Redshift, Google BigQuery, Greenplum, Hadoop with Hive, IBM Db2, Microsoft SQL Server, MongoDB, MySQL, Oracle, PC files, PostgreSQL, Salesforce, SAP HANA, Snowflake, Teradata, JDBC, ODBC drivers. |
| Scalability for large datasets | Designed to scale to thousands of users. SPICE engine ensures fast query performance, even with large datasets. SPICE can handle datasets with billions of rows. The Enterprise Edition supports up to 250 million rows of data per SPICE dataset. | In-memory processing, Cloud Analytic Services (CAS) engine. |
| Integration with cloud services | Integrates seamlessly with AWS services like Amazon S3 and Amazon Redshift. Also integrates with Amazon SageMaker for incorporating machine learning models. | SAS Viya (cloud-native architecture), Microsoft 365. |
| Customization options | Offers built-in themes to personalize the look and feel of reports and dashboards. Dashboards can be embedded into existing applications. Custom-branded email reports are also supported in the Enterprise Edition. | Customizable dashboards, custom themes, various visualization techniques, custom mobile apps (using SAS SDK). |
| Mobile accessibility | Dashboards can be securely shared via browsers or mobile devices. QuickSight also has mobile app support. | Native mobile apps for iOS and Android. |
| Collaboration features | Enables users to invite coworkers to collaborate on analyses and publish dashboards and reports. Simplifies content management by allowing data isolation between end-users and dashboard movement across accounts. | Sharing of interactive reports and dashboards, annotations, comments, email reports, Microsoft Office applications integration. |
| Security and compliance certifications | Offers security features such as role-based access controls, Active Directory integration, AWS CloudTrail auditing, single sign-on, VPC subnets, and data backup. Encrypts data at rest using AWS Key Management Service (KMS). | Encryption, Transport Layer Security (TLS), device whitelisting, passcode protection, WCAG version 2.2 Level AA compliance (aim). |
| Automated insights and machine learning | Uses machine learning to identify patterns, anomalies, and trends in data. Offers features like forecasting, root cause analysis, and contribution analysis. Amazon Q in QuickSight allows users to analyze data and build interactive dashboards more easily. | Automated forecasting, goal seeking, scenario analysis, decision trees, natural language explanations. |
| Reporting and dashboarding features | Provides tools for modern dashboards, paginated reports, natural language queries, and embedded analytics. Supports ad-hoc analysis and pre-built machine learning models for advanced analysis. The Enterprise Edition now supports scheduled and programmatic export to Excel. | Interactive reports and dashboards, key performance metrics summary. |
| Pricing model | Offers a pay-as-you-go pricing model. The Enterprise Edition has a two-tier pricing model: Authors and Readers. Readers have predictable per-user pricing and capacity-based pricing options. | Not available |
| User interface and ease of use | Has an intuitive interface. Offers features like AutoGraph for visualization recommendations and natural language querying with QuickSight Q. | Intuitive interface, self-service data preparation, drag-and-drop interface (no coding). |
Overall Comparison
Data Sources: Comparable; Cloud Integration: AWS vs SAS Viya/M365; Pricing: QuickSight Pay-as-you-go, SAS VA N/A
Pros and Cons
Amazon QuickSight Enterprise
Pros:
- No notable advantages reported.
Cons:
- No major disadvantages reported.
SAS Visual Analytics 9.5
Pros:
- Wide array of visualization techniques
- Natively connects to various data sources
- Handles large datasets using in-memory processing
- Highly customizable dashboards and reports
- Accessible and functional on mobile devices
- Supports collaboration through sharing and annotations
- Offers security features like encryption and TLS
- Provides automated insights with natural language explanations
- Intuitive interface with self-service data preparation
Cons:
- Processing datasets with over 100,000 records can be time-consuming
- Specific details on scheduling automated report generation not found
User Experiences and Feedback
Amazon QuickSight Enterprise
What Users Love
- No highlights reported.
Common Complaints
- No major complaints reported.
Value Perception
- No value feedback reported.
SAS Visual Analytics 9.5
What Users Love
- Enables users to create a wide array of visualization techniques.
- Connects natively to various data sources, including databases, spreadsheets, and big data platforms like Hadoop.
- Dashboards and reports are highly customizable.
- Automated insights are designed to be accurate and useful, providing natural language explanations.
Common Complaints
- One review mentions that processing datasets with over 100,000 records can be time-consuming.
- The search results did not provide specific details on scheduling automated report generation.
Value Perception
- No value feedback reported.